In the era of data analytics, it seems like everything is data-driven. Data and analytics together help us to make smart decisions and enable us to become completely data-driven. The real challenge is about what we do with the enormous data.
Having data that makes sense, helps to connect with the rest of the system, gives confidence, and to be able to quickly access is going to be challenging. Most product managers consider that their decision-making is highly reliant on data than instinct. By 2025, we might need to handle 175 zettabytes of data produced by customers that focus on your day-to-day operations. Product managers should first recognize the opportunity in the first step to leverage data to come up with new ideas, boost their decision, and ultimately create a better user experience.
This blog highlights the framework to organize your data and how it can be applied across businesses.
Data Progression
Being data-driven helps brands to be innovative, enhance operational efficiency, and increase market share. The process of developing an organizational data strategy requires to create a roadmap that demonstrates the below progression:
1. Collect data from various sources into the data warehouse
2. Efficiently funnel the data into a tool (business intelligence tool)
3. Make decisions with insights.
Business intelligence tool to Analyze and Report

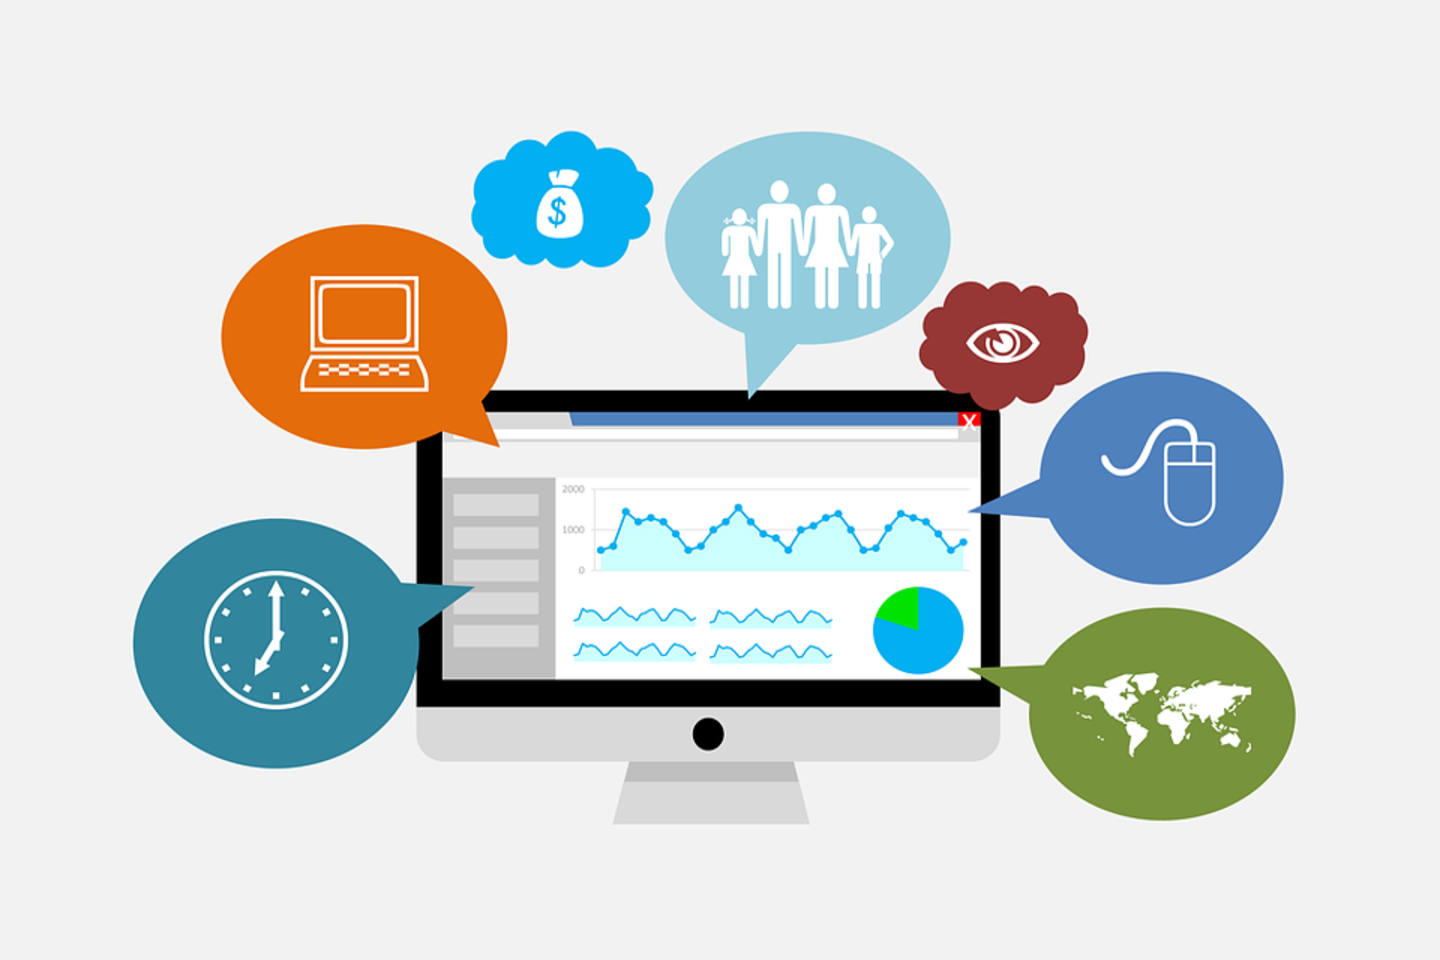
The key objective of business intelligence tools is to enable product managers to make informed decisions. A business-focused to work with BI strategy should have data that is complete, accurate, and organized. BI tools can be used to display patterns to assist managers in determining the organization’s performance and notify them of issues along with potential improvements.
Incorporating BI tools enable you to effectively connect to and query the data warehouse to analyze the data. These BI tools enable you to create dashboards and visualizations that are easy to understand. appICE Business Intelligence tools enable you to generate data, categorize, and send out reports to monitor performance at a high level.
The BI tool makes it easier for businesses to organize, analyze the data, and track the data without complex codes or processes.
Use case of data
The initial stage in organizing data is identifying the critical use case. We can categorize the data into three categories:
1. User Data
2. Business operations Data
3. Generated by Users
The below section highlights how to categorize the data into three sections, how to analyze them, and where they overlap. Furthermore, it also shows how the data is structured, processes, and stored.
Data Type A – About Users
The first data type is about the users that include who they are and what they do. Data about the users play a very crucial role in retaining users. In this competitive market scenario, every business focuses on retaining their customers because the cost of user acquisition is higher than retaining an existing customer. Not only that, the cost of user acquisition is high, so to gain the profit, you should compensate it with user retention with lifetime value.
When it comes to user retention, you should completely understand your user, their activity, what drives retention or churn. These data types should be accessible at all technical and managerial levels to make data-driven decisions.
In simple terms, organized data efficiently answers questions like, where do my users churn? Or which channel brings more user activity such as uploads, likes, and comment
For instance, when we consider Instagram, the common data type includes image uploads from users, which image a user likes, or comments, determines their location, which page does a user follow, and by what time or how frequently they are active on the app.
Data Type B – Business Data
The second data type is about the business operation data that includes user login credentials, pricing, and billing info, which are key for running efficiently.
Handling this data type efficiently helps in smooth business operation because this data type gives a complete insight into how your business is performing and generating revenue. Keeping track of the data will help your business grow. It directly impacts your revenue growth and top-line metrics. Efficiently tracking this data will determine the success or failure of a business. However, this data category can be handled by the data analyst with the help of a business intelligence tool, as it requires technical skills to operate.
Data Type C – Data Created by Users
The final category is about the data created by the user that includes emails, feedback, machine-level logs, user actions like server-side logs, crash metrics, etc. This data type can be efficiently analyzed by the technical team, data scientists, and machine learning. The data created by the user help you understand how your app works and performs, where you should focus on improving customer experience.
The difference between this data type and user data type is the former one is what you have chosen to track your users, and the latter is the data that your customers have chosen to give you.
Takeaway
For any business to succeed, it is highly essential to understand and analyze it irrespective of the data type. Making informed business decisions can help you build better products and easily overcome business challenges. Incorporating business intelligence tools can be useful when you focus on scaling your business to the next level. This was all about Data Driven Decisions with Business Intelligence Tools.
No Comments